Toyota Corolla (E120) 2002–2008 Repair Manual / Diagnostics / Sfi system / Catalyst system efficiency below
threshold / Circuit description
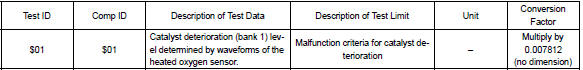
Toyota Corolla (E120): Circuit description
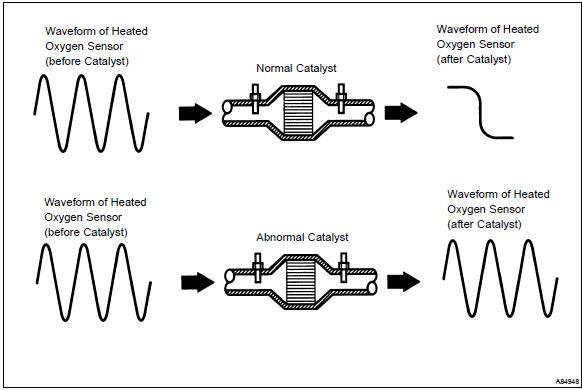
The ecm compares the two waveforms of the heated oxygen sensors located before and after the catalyst to determine whether or not the catalyst performance has deteriorated.
Air–fuel ratio feedback compensation keeps the waveform of the heated oxygen sensor in front of the catalyst alternates between back and forth, from rich to lean.
If the catalyst is functioning normally, the waveform of the heated oxygen sensor behind the catalyst switches back and forth between rich and lean much more slowly than the waveform of the heated oxygen sensor in front of the catalyst.
When both waveforms change at a similar rate, it indicates that the catalyst performance has deteriorated.
Monitor description
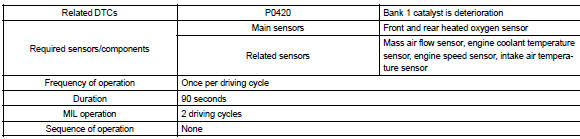
The vehicle is equipped with the two oxygen sensors (o2s). One is mounted upstream from the three–way catalytic (twc) converter (front heated oxygen sensor ”sensor 1” ), the second is mounted downstream (heated oxygen sensor ”sensor 2” ). The catalyst efficiency monitor compares the sensor 1 and 2 signals in order to calculate twc ability to store oxygen.
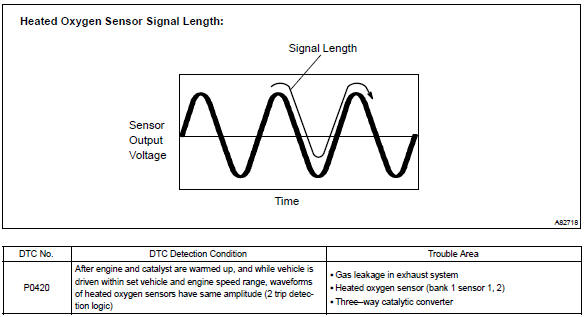
During normal operation, the twc stores and releases oxygen as needed. This results in low oxygen variations in the post twc exhaust stream as shown.
As the twc’s efficiency degrades, its ability to store oxygen is reduced. This causes higher variations in post twc exhaust stream oxygen content and results in increased sensor 2 signal activity as shown.
When running the monitor, the ecm compares sensor1 and sensor 2 signals over a specific time to determine the twc efficiency. The ecm begins by calculating the signal length for both sensors.
Monitor strategy
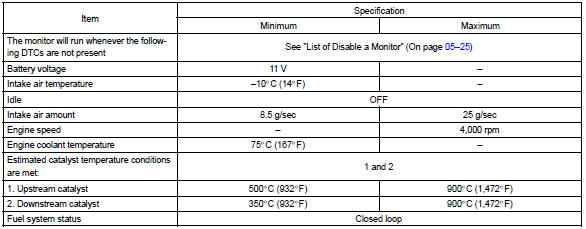
Typical enabling conditions
Typical malfunction thresholds

Component operating range

Monitor result (mode 06 data)
Refer for detailed information on checking monitor status.
Confirmation driving pattern
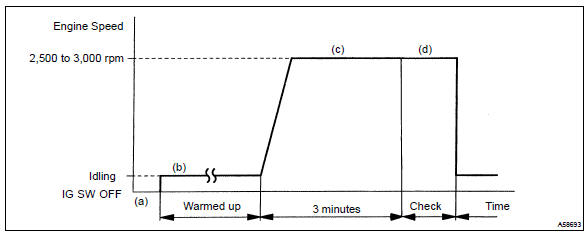
- Connect the hand–held tester to the dlc3, or connect the probe of the oscilloscope between terminals ox1a, ox1b and e1 of the ecm connector.
- start the engine and warm it up with all the accessories switched off until the engine coolant temperature becomes stable.
- run the engine at 2,500 to 3,000 rpm for about 3 minutes.
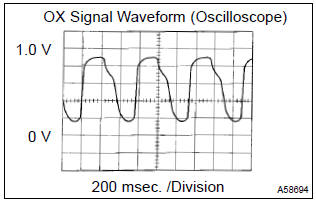
- after confirming that the waveform of the bank 1 sensor 1 (ox) which oscillates between 0 v and 1 v under a feedback to the ecm, check the waveform of the bank 1 sensor 2 (ox).
Hint
: if there is malfunction in the system, the waveform of ”sensor 2” (oxl2) may become a similar to the one of ”sensor1” (oxl1) shown in the diagram on the left.


Other materials:
Clutch
Preparation
Sst
Recomended tools
Equipment
Lubricant
...
Replacing light bulbs
■ Headlight high beams
1 Turn the bulb base counterclockwise.
2 Pull the bulb out while pressing the lock release of the connector.
3 Replace the light bulb, and install the bulb base.
Align the 3 tabs on the light bulb with the mounting and insert.
4 Turn and secure the bulb base.
...
Other functions
■ Switching between outside air and recirculated air modes
Press .
The mode switches between outside air mode (indicator off) and recirculated air
mode (indicator on) each time is pressed.
■ Defogging the windshield
Defoggers are used to defog the windshield and front side w ...